A graphviz tutorial
Mike GriffinFollowing on from this post I thought it could be useful to show the steps that I went through to go from a blank canvas to a full network diagram.
All the source code is available on github
Step 1 - Create a switch node
graph switches {
  sw1 [ label="Switch 1\\n192.168.1.101" ];
}
Step 2 - Join it to another
graph switches {
  sw1 [ label="Switch 1\\n192.168.1.101" ];
  sw2 [ label="Switch 2\\n192.168.1.100" ];
  sw1 -- sw2;
}
Step 3 - Add colour
graph switches {
  sw1 [ label="Switch 1\\n192.168.1.101" ];
  sw2 [ label="Switch 2\\n192.168.1.100" ];
  sw3 [ label="Switch 3\\n192.168.1.252" ];
  sw4 [ label="Another Switch\\n192.168.1.251" ];
  router [ label="Cisco\\nVPN Router\\n192.168.1.250" color="#cf7b7b"];
  ap1 [ label="Wireless\\nAccess Point\\n192.168.1.61" color="#a8d1b0"];
  router -- sw1;
  sw1 -- sw2;
  sw1 -- sw3;
  sw1 -- ap1;
  sw2 -- sw4;
}
Step 4 - Change the layout of the nodes
Add this to the top of the file inside the first curly brackets
node [
    shape=box,
    fontname="arial",
    fontsize=8,
    style=filled,
    color="#d3edea"
  ];
  splines="compound"
Step 5 - Add images
Images can be added to any node easily in the following way
cloud [ label="The Internet" shape=none, image="images\\cloud.png" labelloc=b color="#ffffff"]First, we have to remove the shape with shape=none. Then we add the path to
the image and set a background colour to match the background of the added
image and the rest of the graph. labelloc = b sets the label to the bottom.
Step 6 - Colour the links
We can add colour to show what speed the links between the nodes run at very easily.
sw1 -- sw2 [color="#ffbb00"];Step 7 - Add a title
Finally we add a title with label="Network Diagram";
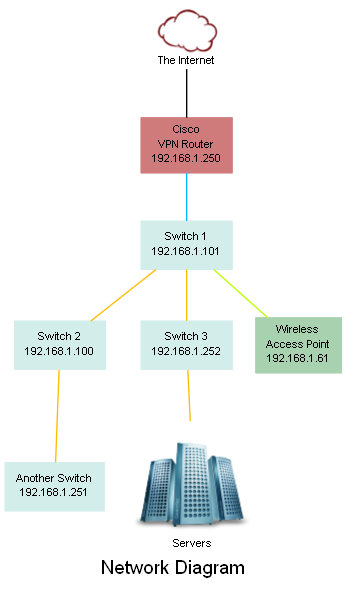
The final image
The final image looks like this. It shows the hierarchy of the switches and even where the servers are connected as well.